
Access Restricted for EU Residents
You are attempting to access a website operated by an entity not regulated in the EU. Products and services on this website do not comply with EU laws or ESMA investor-protection standards.
As an EU resident, you cannot proceed to the offshore website.
Please continue on the EU-regulated website to ensure full regulatory protection.
Thursday Jun 25 2026 09:59

5 min

For oil traders, bulls in particular, Thursday brought another bruising session, with crude slipping below $70 a barrel and extending a four-day sell-off that has all but erased the gains fueled by the Middle East conflict from the start. The catalyst is unmistakable: the US and Iran are inching closer to a lasting peace deal, and with that, the supply fears that once gripped the market are rapidly unwinding. Tankers are now moving through the Strait of Hormuz with their tracking signals switched on, a clear sign that the perceived risk of attack is fading. At the same time, buyers are being flooded with offers from the Middle East and beyond, including a wave of West African crude, while a temporary US waiver for already-loaded Iranian oil is set to add yet more barrels to an already well-supplied market. The mood shift is perhaps best captured by Brent's prompt spread, a reliable barometer of market tightness, which on Wednesday flipped into contango for the first time since the conflict began, a textbook signal that the market is no longer worried about shortages.
This week, WTI crude oil price has fallen to the level, where it was at the beginning of the conflict in the Middle East. However, the commodity continues to show willingness to move lower, but we have to accept the fact that there might be a strong area of support coming up. That area is roughly between the 66.50 and 67.30 levels, marked by the highs of 29(th) January and 23(rd) February. If it continues to hold, there might be a relief bounce back up, as some buyers may take advantage of the lower price. However, if such a move occurs, we would still stay more on the cautious side, as the correction higher could still be short-lived. Our possible target might be near the 75.00 obstacle, or even around the 79.00 zone, marked by the lowest point of April.
Alternatively, if the previously discussed support area breaks, that may send WTI oil further south, possibly targeting the 62.36 hurdle, marked near the high of 14(th) January and the lows of 6(th), 13(th) and 18(th) February. If that hurdle is unable to slowdown the bears, a break of it could lead WTI oil price to the next potential support zone, at 55.00, marked by the lowest point of 2025.
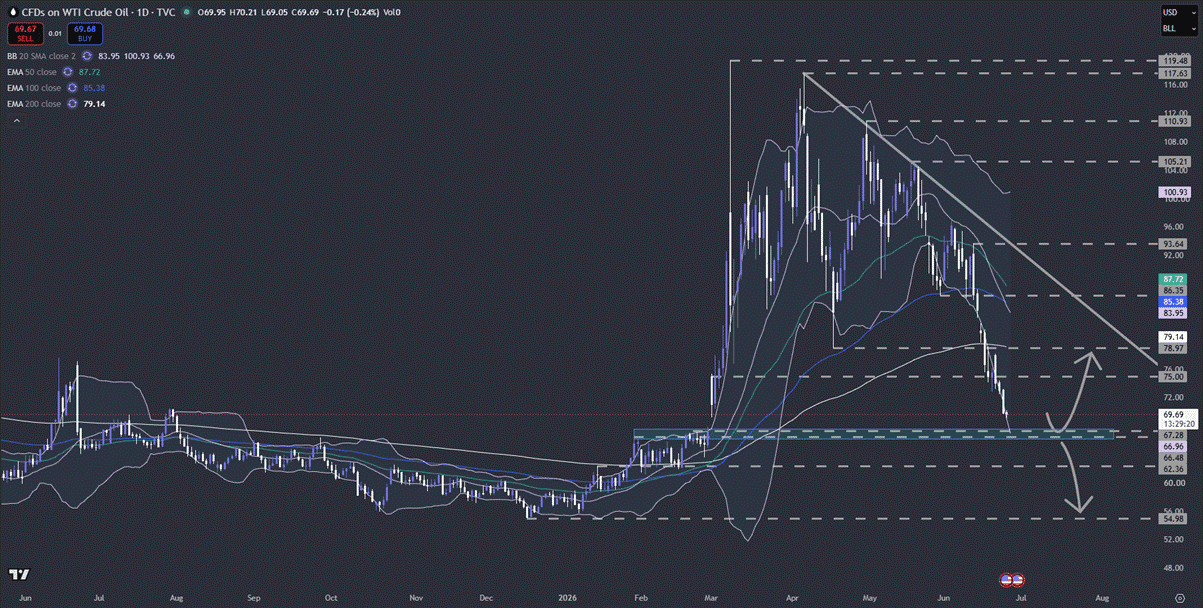
(WTI oil daily chart. Source: tradingview.com)
Gold's glitter has been decidedly tarnished this week, with the precious metal tumbling below $4,000 an ounce on Thursday and creeping toward its lowest level in nearly eight months, a sell-off driven by a resurgent dollar and the Federal Reserve's increasingly hawkish tone. The greenback has powered to its highest point in over a year against a basket of peers, making gold a far more expensive proposition for overseas buyers and chilling demand. The Fed may have held rates steady at last week's meeting, but Chair Kevin Warsh left little doubt about his intent: inflation must be vanquished, even if it means tightening policy further. The market has listened intently, now pricing in a potential hike in September and possibly another before the year closes. And here is the irony, the very forces that might have been expected to support gold, namely the US-Iran peace momentum that has sent oil prices crashing back to pre-conflict levels and eased inflation angst, have been completely overshadowed by the dollar's strength and the Fed's relentless messaging. For gold, it is a classic case of being caught in the crossfire.
A break below the psychological 4000 zone confirmed a forthcoming lower low. Such a move is now possibly opening the door towards further declines, where the next potential target could be near the 3886 hurdle, marked by the low of 28(th) October 2025. The precious metal might stall there for a bit, however, if the bearish pressure remains, the next possible support zone might be seen around the 3627 level. That level marks the low of 18(th) September 2025.
In order to start shifting our attention to some higher areas in the near term, we would prefer to wait for a move back above the psychological 4000 zone, or even the 4024 mark, which is the low of 11(th) June. This way, we may start considering a potential larger correction back up again. That’s when we aim for a possible test of the 4306 area, marked by the inside swing low of 16(th) of June. Around there the price could also test the medium-term downside resistance line, drawn from the current all-time high.
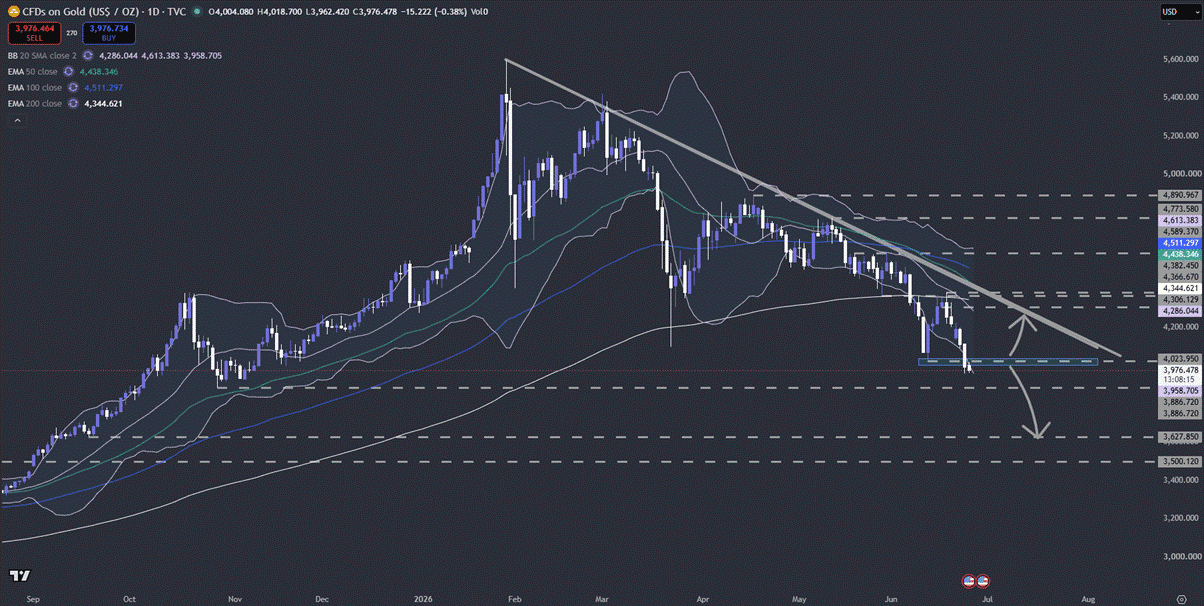
(Gold daily chart. Source: tradingview.com)
Risk Warning: This article is provided for informational purposes only and does not constitute investment advice, investment research, or a recommendation to trade. The views expressed are those of the author and do not necessarily reflect the position of Markets.com. When considering shares, indices, forex (foreign exchange), and commodities for trading and price predictions, remember that trading CFDs involves a significant degree of risk and may not be suitable for all investors. Leveraged products can result in capital loss. Past performance is not indicative of future results. Before trading, ensure you fully understand the risks involved and consider your investment objectives and level of experience. Cryptocurrency CFD trading restrictions may apply depending on jurisdiction.
Latest
View all
Friday, 9 October 2026
17 min

Friday, 9 October 2026
11 min

Friday, 9 October 2026
6 min


 EN
EN





